Class: Math 8 – Relationships: Making and Modeling Connections with Geometry, Algebra, and Statistics
Grade: 8
Teacher: Kate O’Dowd
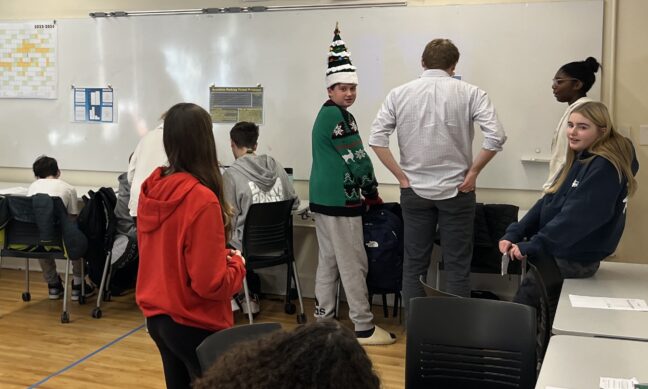
Math 8 students immersed themselves in the world of parking laws during an assignment tasking them with reimagining what parking ticket fees look like. The assignment could not be completed with math alone; instead, students conducted research, interviewed a local parking expert, and considered how parking ticket fees can impact an entire community.
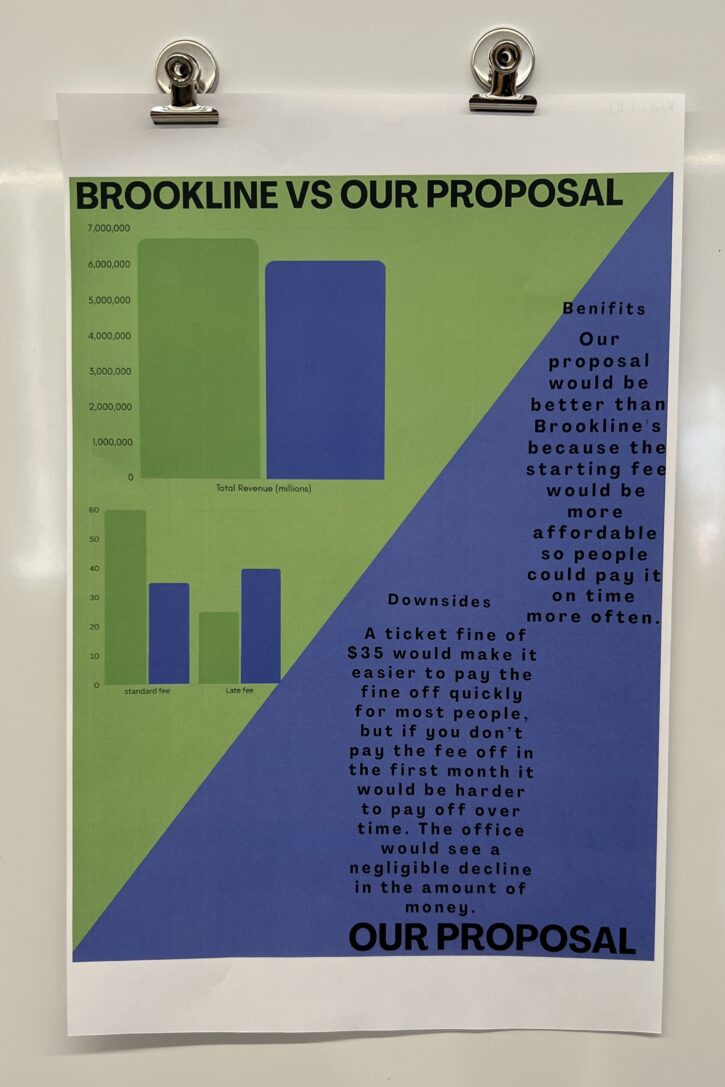
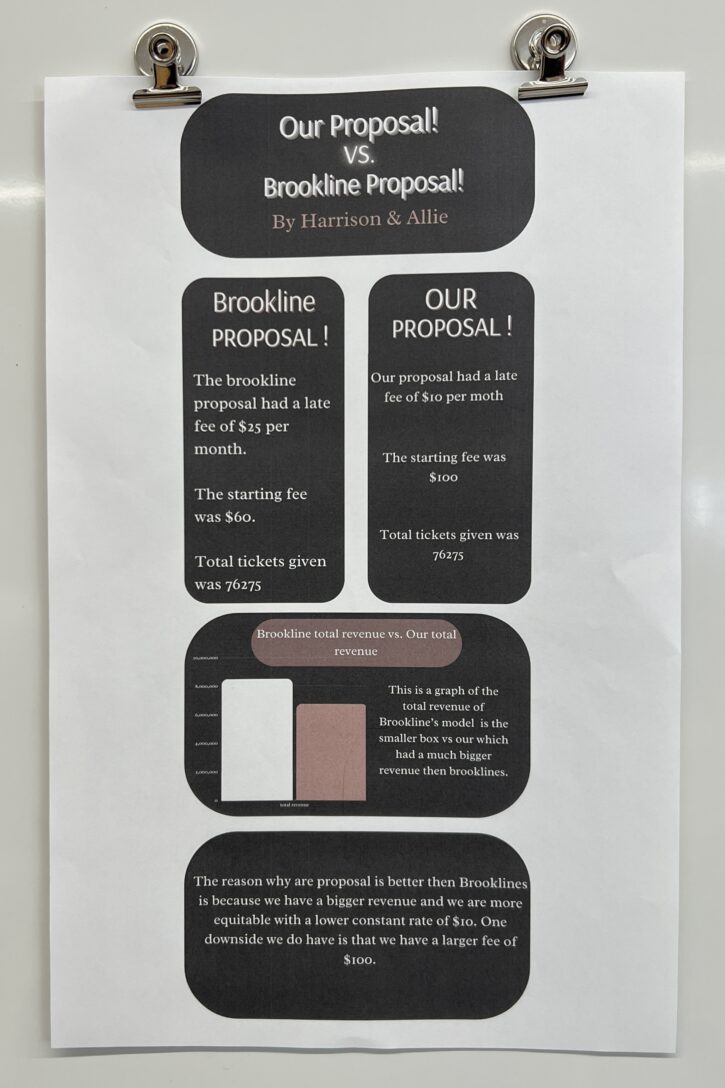
During their research, students quickly began to uncover stories of the financial burden local parking ticket fees were placing upon families. Due to base parking ticket fees compounding with late fees, students found that fees often near $100. This research also brought students an understanding of how the money gained from parking laws is utilized by the town of Brookline.
To lessen the financial burden but maintain the revenue for the town of Brookline, students leveraged their understanding linear functions to calculate new plans. As one student states, “I would say the hardest part of the assignment was the math. A lot of our work was on Google Sheets and we had to use certain algorithms to do the work. I think we ended up finding a good balance of fees.” The class was also tasked with creating visual presentations of their data, including bar graphs and comparisons to Brookline’s parking fees.
The parking ticket fee project allowed Math 8 students to see math in a real-world context. By viewing linear functions and bar graphs through the lens of a local issue, a deeper understanding of both math and local government was gained. Looking ahead, students are eager to engage with more real-life problems using the skills they develop throughout the year.
More about this course: Math 8 will focus on relationships across three domains: geometry, algebra, statistics. In geometry, students will examine the relationships of congruence and similarity through transformations and uncover the meaning behind the symbols of the Pythagorean Theorem by investigating the relationship between the three sides of a right triangle. Students will extend their algebraic understanding to include systems of linear equations and inequalities and expand beyond linear functions to investigate exponential and quadratic models. Students will analyze relationships between variables in real data by considering different visualizations including function models while examining regression and linear trends.